-
Client FromCanada
-
Solution We DevelopedInfographic Maker
-
Year 2022
-
Platform Web Solution

Abstract of Graphical Infographic Maker
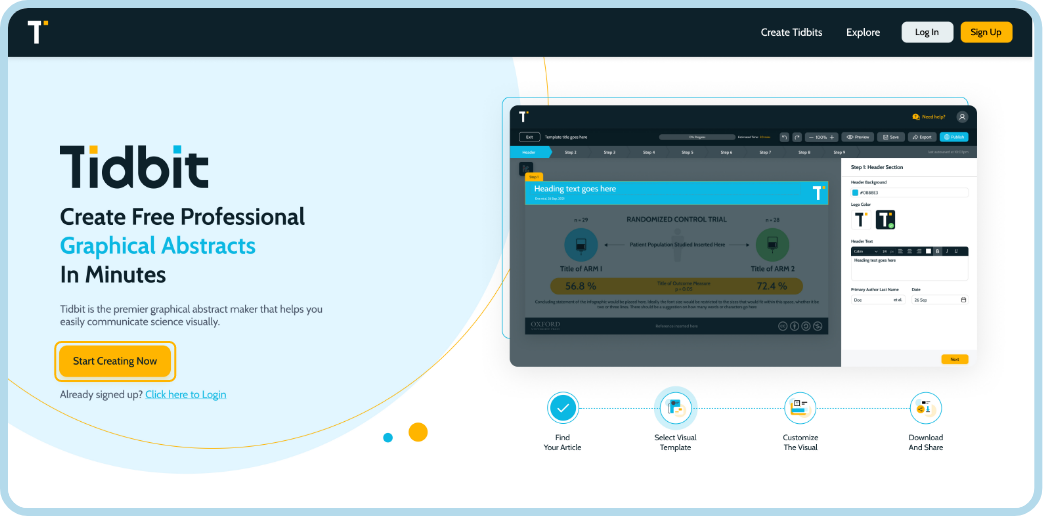
Tidbit is a free and easy-to-use infographic maker that helps researchers to create interactive infographics within a few minutes using professional infographic templates. Oxford, Harward, UCSF, University of Toronto, and McMaster are a few of the universities that have used this infographic maker solution.
Within just 7 steps, you are able to create a graphical representation of your research. Using Tidbit, you can directly submit your infographics to the top publishers around the world.
This web solution offers three subscription plans to its users that include Standard, Professional, and Institution with charges as free, $9.99 per visual, and custom respectively. If you are a researcher and looking for an infographic maker for creating an infographic maker, you must try Tidbit.
Client’s Requirements
Our client is from Canada, and he is a computer scientist. During his research study, he wanted to make an infographic to summarize the research, but he didn’t find a proper solution. He got the idea to develop a web solution.
As our client has a deep understanding of crypto, distributed systems, and design, he had very high-expectation for creating a Tidbit app solution. To achieve that, he wanted an experienced software development company, and during research, he found us on Google. Later, he shared his requirements with us to get started.
The requirements of our client are as follows:
- A web solution that helps to create an infographic maker.
- A solution that connects scholars with publishers on a single platform.
- A solution having ready-made templates that speed up the designing of an infographic.

Tidbit Web App Flow

Solution We Developed for Our Client
Our team front-end development team having expertise in React.js understood his requirements and validated his idea to create the front end of the project. We started work from scratch and started designing the different components of projects. From the design of user-end UI to the internal UI of the website, and everything in-between.

Challenges We Faced
During designing the internal layout of this web solution, we faced the following challenge:
- Highlight a portion of the screen in which the real-time editing is getting done by the end-users. The rest of the things on the screen should get blurred.
- But, there were no by-default properties in this framework, so need to code everything custom.
- Our React.js developers researched and worked on creating custom CSS properties that align with the framework and provide the expected output.
- After researching and developing CSS properties, they integrated the same into the solution to fulfill the expectation of our client.

Want to Create a Graphic Design Web Solution?
Let’s discuss your requirements. Get a consultation from our experienced developers to validate your web app idea and get development started. Let’s talk.
Features of Tidbit

Dashboard
Get an option to create an infographic by selecting one of two available options; published article or preprint manuscript. Use pre-uploaded infographic templates for creating graphical abstracts based on your research.

Search Functionality
Find your published article with the search function. To find, write the name of your article and get the list. Further, select your article to get started.

Select a Template
Get a list of infographic templates to make your infographic maker. The list of templates includes general, randomized, systematic, prospective, retrospective, case-control, cross-sectional, and more. Choose the most suitable template as per your research study.

Content Editor
Add, update, edit, and delete the things that you want to include in your research paper. Get editing options like background colour with multiple options, change icons, and change the description as per your requirements.

Zoom, Save, and Export
Get the notification in the app about new offers, orders placed, and delivered orders. This way, push notification allows you to stay updated about the mobile app.

Add Elements
Schedule the orders from the material app. So, you get free from ordering the same soft drinks again and again with a scheduled orders feature. It is easy to order the beverages by selecting a period of time like monthly supply.

Change the Theme
Update the colour of your infographic maker. Easily change the colour of the theme as you want and correlate it with your graphics and icon within the template.

Publish
Send your graphical visual representation for publication in journals, institutions, and universities to showcase your work. Just a single to send your infographic onto reputed platforms and get your work recognized.

Undo and Redo
Changes you make that might be perfect or not. That’s where Undo and Redo options are provided to you within the panel. This way, if you have done anything wrong, you can undo it. In addition, if you mistakenly Undo it, then you have the option of Redo it.
Dashboard
Get all the details of submitted, approved, rejected, and pending requests of infographics sent by researchers for publishing in popular journals like Times of India etc. This feature makes it easy to manage all the infographic requests.
Content Editor
Edit and update the infographics’ heading and footer colour. With this feature, publishers can update the colour of the infographic’s heading and footer and icons per their requirements.
Send for Publishing
Sent the approved infographic to publish in the journals. Select the infographic from the list of approved ones and make them live according to your requirements. With this feature, publishers get all the details of published journals from their end.
Tidbit Web Solution Screens
Tidbit App
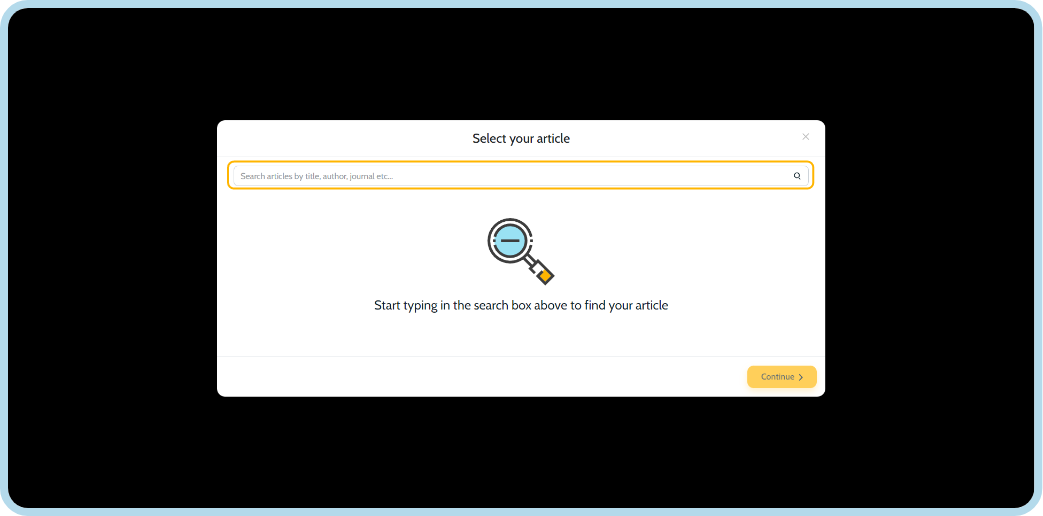
Search your published research study
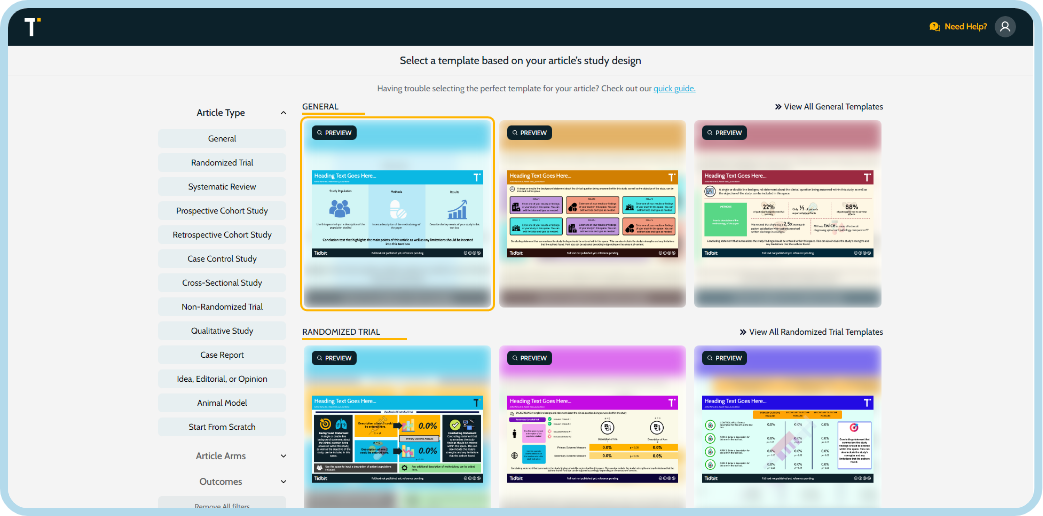
Choose a template to create an infographic
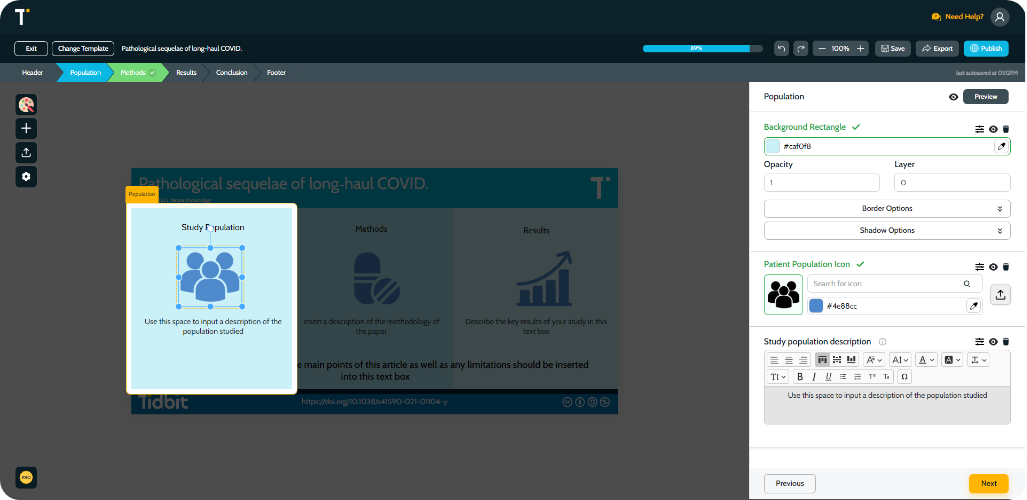
Add and update your research data
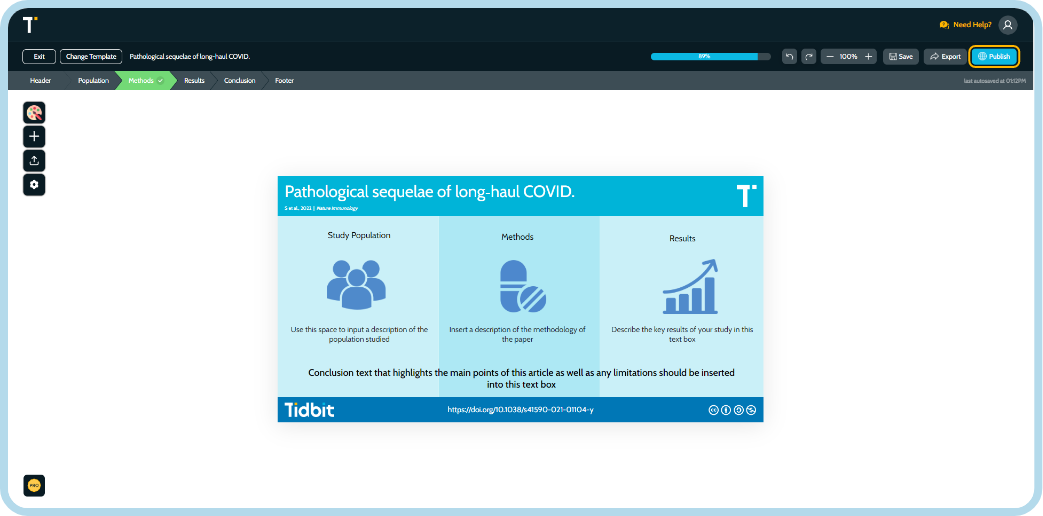
Publish your infographic
Technology Stack
Front-end
 React JS
Database
 MySQL
MySQL
Back-end
 Ruby on Rails
Top Apps Developed By Us
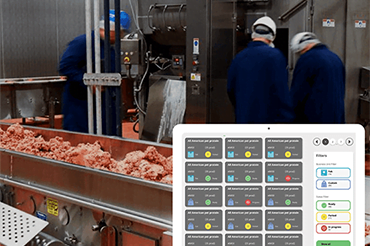
Software Solution for Meat Processing
This software automates the entire operation from receiving and tracking orders via one platform. It generated reports in a single click, saving 70% time and eliminating paper-based reports.
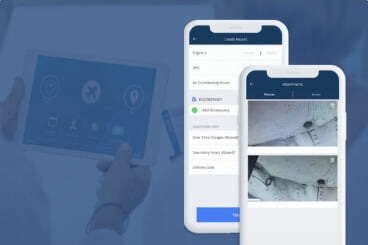
Aviation Inspection Application
Brakes Off is a cloud-based inspection software for aviation companies that performs inspection faster and ensures safety. This software has replaced the traditional paper-based methods of generating reports with digital solutions.
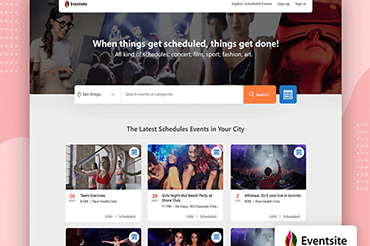
We have developed an event management website that enables companies and users to create their profiles for business networking. Through this solution, businesses check insights, promote services, and generate sales.